Akinlolu-Matthew-Oyetakin
Staff Exit Analysis Dashboard
An interactive Power BI dashboard analysing employee exit patterns across departments, gender, job type, and exit reasons to support HR decision-making and retention strategy.
Problem Statement
Organisations often struggle to identify why employees leave and which groups are most affected. This project analyses exit data across 5,496 employees to surface trends that HR and leadership can act on.
Tools Used
- Power BI – Dashboard design, DAX measures, interactive slicers
- Excel / SQL – Data cleaning and preparation
Dashboard Features
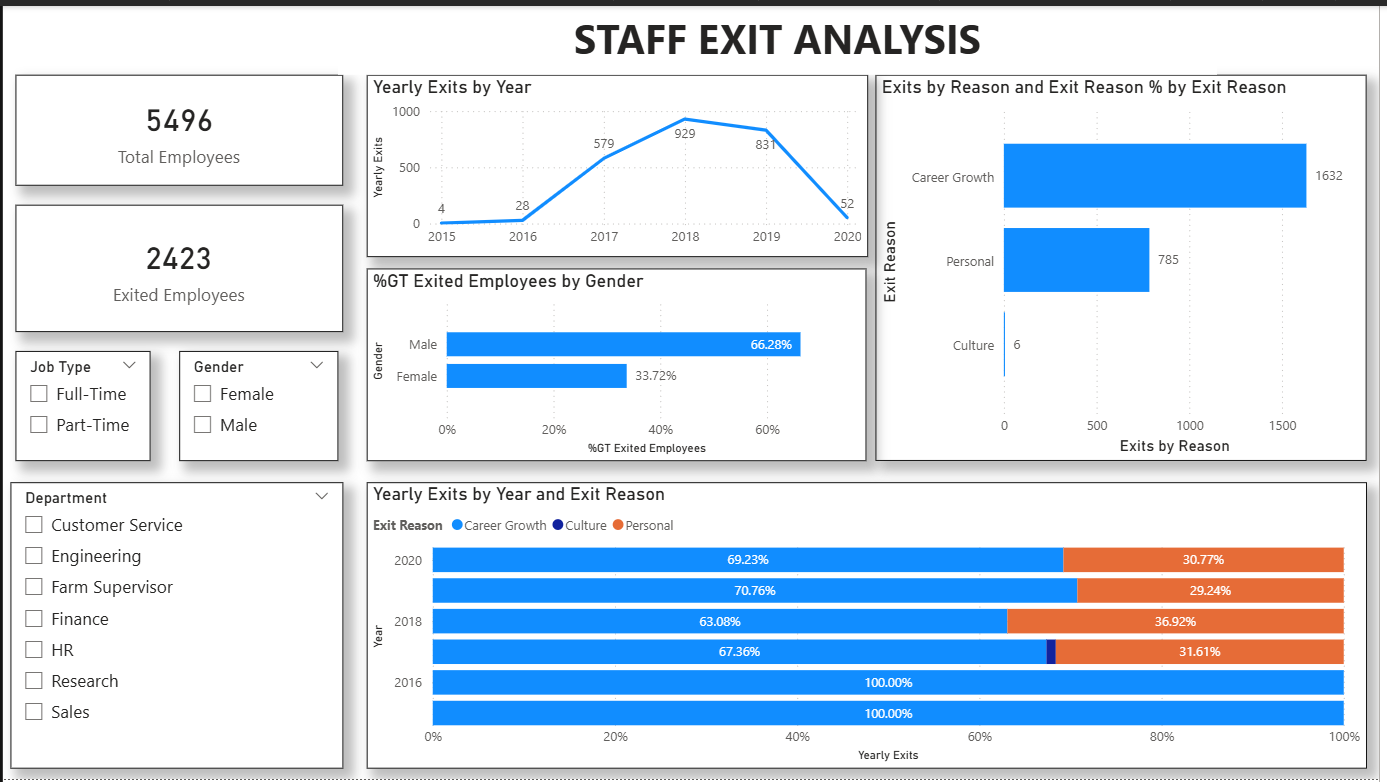
- KPI Cards – Total employees (5,496) and exited employees (2,423)
- Yearly Exit Trend – Line chart tracking exits from 2015–2020
- Exit by Reason – Career Growth (1,632), Personal (785), Culture (6)
- Gender Breakdown – Male 66.28% vs Female 33.72% of exits
- Yearly Exits by Reason – 100% stacked bar showing reason split per year
- Interactive Filters – Sliceable by Job Type, Gender, and Department
Key Findings
- 2,423 out of 5,496 employees exited — a 44% attrition rate
- Career Growth is the dominant exit reason, accounting for the majority of departures every year
- Exit volume peaked in 2018 (929) before declining sharply to 52 in 2020
- Male employees account for nearly two-thirds of all exits (66.28%)
- Culture-related exits are minimal (6), suggesting internal culture is not a primary driver of attrition
Recommendations
- Invest in structured career development programmes to address the leading exit driver
- Investigate why male employees exit at a disproportionately higher rate
- Explore the sharp 2020 decline — determine whether this reflects improved retention or external factors (e.g. COVID-19)
Dashboard Preview
Author
Akinlolu Oyetakin – Data Analyst
LinkedIn